Description
Heya all,
When using Angular CLI 1.5 together with Angular 5.0.0, ng serve will default to using --aot=true. We added a new pipeline that should make AOT compilation much faster than it was with older CLI and Angular versions so we felt confident that AOT rebuild speeds should be much better.
Bigger projects can still have slow AOT rebuilds though. You can disable AOT by passing on the --no-aot (or --aot=false) flag, but if you have time I'd also like to ask for your help debugging remaining bottlenecks.
A good way to figure out how time is being spent in a rebuild is via CPU profiles. These show what functions are being called and how much time is being spent in each function.
This is how you can capture a CPU profile and share it here:
- Make sure your project is using the following dependencies:
- At least
@angular/[email protected]. - At least
@angular/[email protected], together with other@angular/*packages. - At least
[email protected]. - Exactly
[email protected], newer versions might work but this is the latest officially supported by@angular/compiler-cli.
- At least
- Open
chrome://inspect/#devicesin chrome, and then clickOpen dedicated DevTools for Node. This will give you a window calledDeveloper Tools - Node.jsthat we'll get back to in a second. - In your
package.json, add the following NPM script:"debug": "node--max_old_space_size=8192 --inspect --debug-brk ./node_modules/@angular/cli/bin/ng serve"- This script tells node to start Angular CLI with the node debugger, and also to raise the maximum memory limit.
- Run
npm run debug. - The
Open dedicated DevTools for Nodewindow should pop up. It is stopped on the very first line of Angular CLI. Click theResumebutton in the upper left corner of that window:

- Wait until the initial build is finalized.
- Open your apps
main.tsfile, addconsole.log(1);to the end of it and save. Do this 3 times.- Saving a file without code changes won't trigger trigger a real rebuild, we have to actually change code like adding a
console.log. - The first few rebuilds can take longer than others, so we ignore them.
- Saving a file without code changes won't trigger trigger a real rebuild, we have to actually change code like adding a
- Now we will capture the CPU profile of a rebuild:
- Go back to the
Open dedicated DevTools for Nodewindow. - Click the right-most tab, called
Profiler. - Click
Start. - Add another
console.log(1);tomain.tsand save it. - Wait until the rebuild finishes.
- Click the
Stopbutton in the profiler tab. - Wait until
Profile 1shows up on the left, and then click it (opening it can take some time for big projects).
- Go back to the
- You should see a chart. Zoom into it until you get all of it in the screen, take a screenshot and post it here.
-
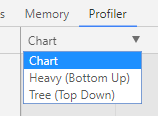
If you don't see a chart, click the dropdown beneath
Profilerand selectChartfrom there.
-
This is how it looks like for a new project:

-
- Right click
Profile 1, clickSave. Upload it somewhere and link it here.- I uploaded it to google drive: https://drive.google.com/open?id=0B06an8Bxmi7URXhhRzMxLWpPQmM
Then I can look at the CPU profile and see where time is being spent on your rebuild. Hopefully I can find new bottlenecks and make your builds faster.
Note: Sometimes the debugger doesn't disconnect after you quit the ng serve process. If you have to do this process more than once and get Unable to open devtools socket: address already in use when running npm run debug, open your process manager and kill any existing Node.js processes.