Open
Description
Hello!
I want to use dynamic ticks for plots in application. With that, need not to limit the plot by x axis (i want some spaces on the borders). I do that by "autorange = FALSE" in layot. For single plot it's work fine, but for facet_wrap or facet_grid plots it works fine only for the first plot (left). I tried to use xlim, coord_cartesian with xlim, scale_x_continuous. Nothing helps.
Plots are created using ggplot2 (ver. 3.1.0) and then rendered using ggplotly (plotly ver. 4.8.0).
My code:
library(data.table)
library(plotly)
library(ggplot2)

a1 <- c(1:50)
b1 <- rnorm(50, 30, 10)
c1 <- c(rep(c("abc","def"),25))
dt <- as.data.table(list("valueX" = a1, "valueY" = b1, "facetCol" = c1))
dt$facetCol <- as.factor(dt$facetCol)

pplot <- ggplot() + geom_line(data = dt, aes(x = valueX, y = valueY)) +
                    facet_wrap(~dt$facetCol, ncol = 2)
ggplotly(dynamicTicks = TRUE, pplot) %>% layout(xaxis = list(autorange = FALSE))
How i see it:
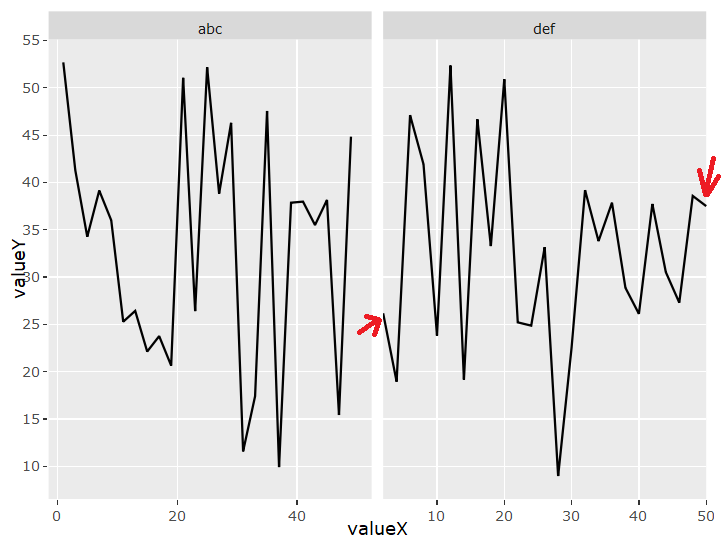
What i want:
