Closed
Description
Thank you for this fantastic package -- I am amazed how well it works!
When multiple geom_line() or geom_point() entries exist, the ggplotly() output can be different from the ggplot() output. What I've noticed is duplication of legend entries and sometimes ignoring of legend configuration options that ggplot provides.
Seems possibly related to #572 & #2010
df1 <- data.frame(
"Date" = seq(as.Date("2021-01-01"), as.Date("2021-01-10"), "days"),
"Series" = c(rep("SeriesA", 10), rep("SeriesB",10)),
"Values" = rnorm(n = 20),
"Mean" = 0,
"V1" = 2,
"V2" = -2
)
p <- ggplot(df1, aes(x=Date, y=Values, color = Series, linetype = Series, shape = Series)) +
geom_line(aes(x = Date, y = Mean, color = "Mean", linetype = "Mean")) +
geom_line(aes(x = Date, y = V1, color = "QC", linetype = "QC")) +
geom_line(aes(x = Date, y = V2, color = "QC", linetype = "QC")) +
geom_line() +
geom_point() +
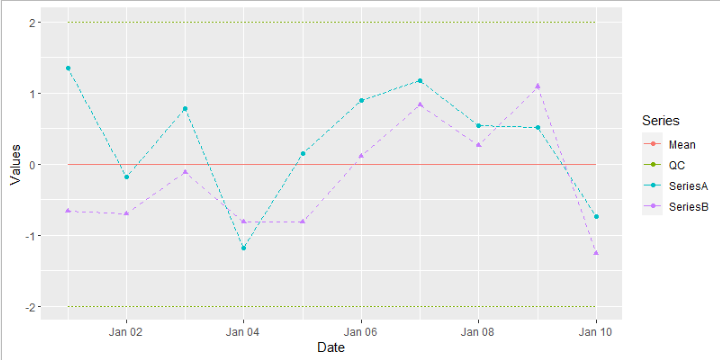
guides(shape=FALSE, linetype=FALSE)
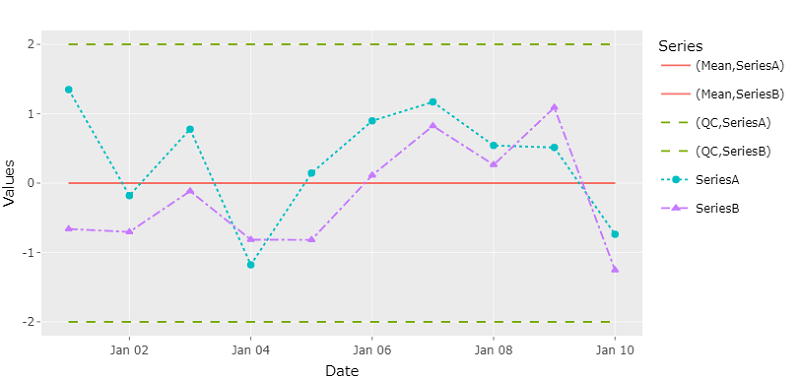
ggplotly(p)ggplot() Output
ggplotly() Output
Metadata
Metadata
Assignees
Labels
No labels