Description
Hello, here are a few issues shared across many (majority) plots.
The code are examples found in MATLAB's online documentation. MATLAB and PLOTLY .png are obtained by using following code:
saveas(gcf, image_save_location_matlab);            % write MATLAB image

f = fig2plotly(gcf, 'open', false, 'strip', true);  % convert matlab plot gcf to plotly
write_image(f, 'png', image_save_location_plotly);  % write plotly image
different colour shades, font sizes, thickness of elements in the plot (lines, borders, asix-ticks, boxes, text, etc..)
Every plot
missing legend, title, axis names, different axis ticks
Every plot. Axis names, title, legend are not displayed.
plots do not have tick labels inside the plot
axis tick frequency is often not the same
example 1 - code - matlab_png - plotly_png - different x-axis tick frequency, no labels inside the plot
example 2 - code - matlab_png - plotly_png - different axis tick frequency, no labels inside the plot, no mathematical equation legend underneath the plot
example 3 - code - matlab_png - plotly_png - different x-axis tick frequency, no title
3d plot - initial camera angle
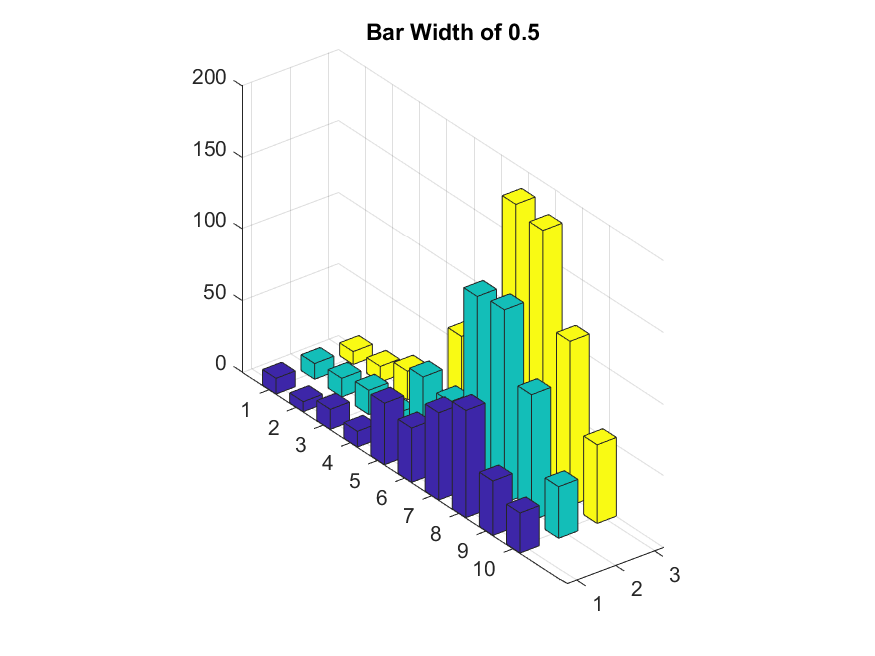
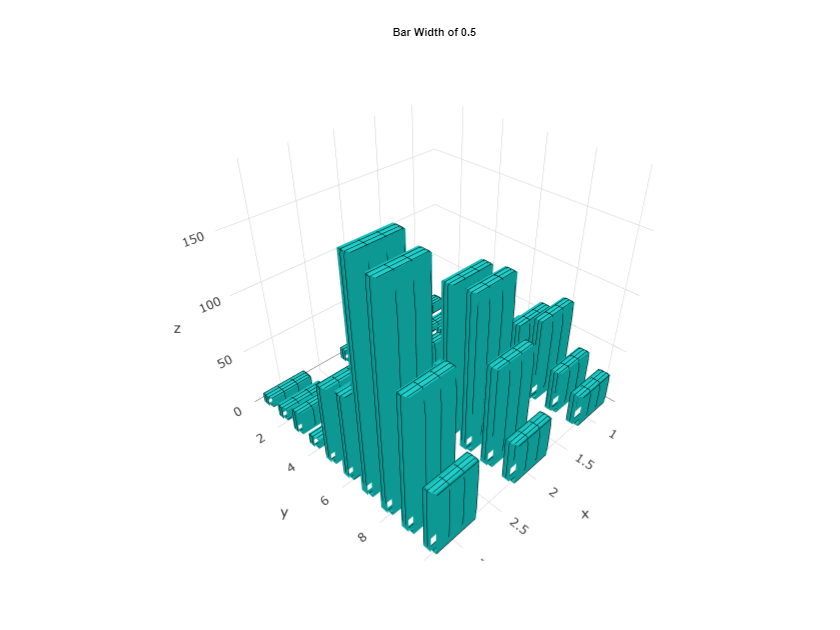
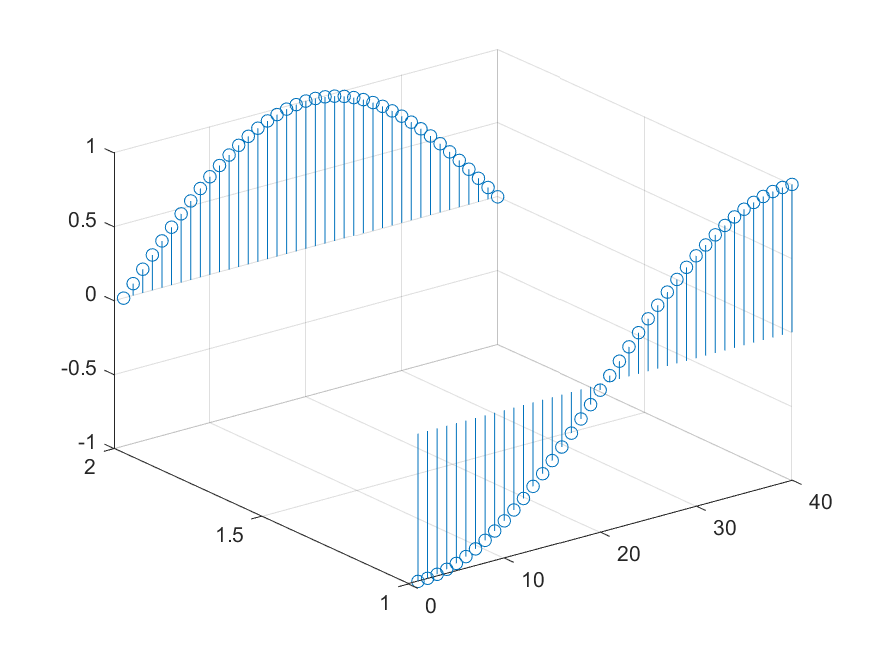
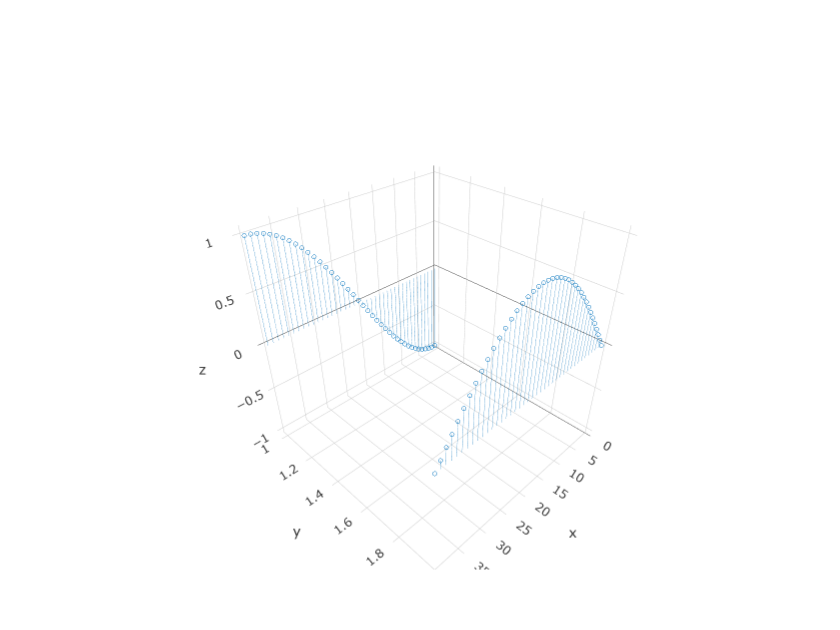
All 3d plots generage with the camera pointing from the opposite angle as MATLAB's plot. (what I means is: imagine looking at your keyboard from the left-front side, focusing on the left-front corner, fig2plotly will look at it from the right-back side, focusing on the right-back corner). It changes the displayed axis marks since it's looking at it from different angle, and since majority of the plots are not symmetrical (as the keyboard), the two plots are rotated (and look very different)
example 1 - code - matlab_png - plotly_png - MATLAB image has 0,0 close and 1,1 far. PLOTLY images has 1,1 close, and 0,0 far.
example 2 - code - matlab_png - plotly_png - Rotated
example 3 - code - matlab_png - plotly_png - MATLAB image has yellow data row (tallest) is on the right. PLOTLY has it on the left.
example 4 - code - matlab_png - plotly_png - MATLAB image has the twirl that goes down on the fron. PLOTLY has it on the back
3d plot - plot scaling in z-axis
Have a look at all the examples from the 3d plot - initial camera angle section.
More examples:
example 1 - code - matlab_png - plotly_png
contour plots - no fill
These plots do not get filled by plotly.
example 1 - all of these
contour plots - undesired fill
These plots get filled even though MATLAB does not fill them.
example 1 - all of these
contour plots - 2d plot interpretted as 3d
Note that there is Z argument in all of these, however, MATLAB keeps them 2d.
example 1 - all of these
example 1 - all of these
white canvas if there is more than one plot
Note: there are a few examples where this works so I am not sure if it is a global problem, or something that is unique for every plot type.
example 1 - code - matlab_png - plotly_png
example 2 - code - matlab_png - plotly_png
example 3 - code - matlab_png - plotly_png