CTFE interning: don't walk allocations that don't need it #97585
Conversation
|
Some changes occured to the CTFE / Miri engine cc @rust-lang/miri |
|
r? @estebank (rust-highfive has picked a reviewer for you, use r? to override) |
|
r? @ghost |
|
Opening as draft as I still need to ensure test coverage is sufficient, and add some if necessary. It worked locally in my small scale tests. @bors try @rust-timer queue |
|
Awaiting bors try build completion. @rustbot label: +S-waiting-on-perf |
|
⌛ Trying commit 6c492abbbc94e85c545e996922b0275b4580265f with merge 0aa3f5e10899462a2f253e01eb637fa40eee7095... |
|
☀️ Try build successful - checks-actions |
|
Queued 0aa3f5e10899462a2f253e01eb637fa40eee7095 with parent 16a0d03, future comparison URL. |
|
Finished benchmarking commit (0aa3f5e10899462a2f253e01eb637fa40eee7095): comparison url. Instruction count
Max RSS (memory usage)Results
CyclesResults
If you disagree with this performance assessment, please file an issue in rust-lang/rustc-perf. Benchmarking this pull request likely means that it is perf-sensitive, so we're automatically marking it as not fit for rolling up. While you can manually mark this PR as fit for rollup, we strongly recommend not doing so since this PR may lead to changes in compiler perf. @bors rollup=never Footnotes |
f585e27 to
40172c5
Compare
|
cc @RalfJung this PR does a work-skipping in the interner that is mostly copied from validation |
|
I've updated the PR's description with numbers and examples of the cases I looked at. I don't believe (and oli seems to agree) interning itself is easily testable beyond the existing tests of the CTFE, smoke tests crates, and bootstrapping. So I'll mark this as ready to review, and r? @oli-obk or @RalfJung. |
|
r? @RalfJung as I worked with lqd directly on the impl |
That sentence in the PR description just ends mid-way? |
|
Some changes occurred to the CTFE / Miri engine cc @rust-lang/miri Some changes occurred to the CTFE / Miri engine cc @rust-lang/miri |
|
@bors try @rust-timer queue |
|
Awaiting bors try build completion. @rustbot label: +S-waiting-on-perf |
|
⌛ Trying commit 2344e664aae22c0a3c29e4caa26fa51db4e1a6a4 with merge f983b52da2d21c5393097bc352068af1ebe07bab... |
|
☀️ Try build successful - checks-actions |
|
Queued f983b52da2d21c5393097bc352068af1ebe07bab with parent 94e9374, future comparison URL. |
|
Finished benchmarking commit (f983b52da2d21c5393097bc352068af1ebe07bab): comparison url. Instruction count
Max RSS (memory usage)Results
CyclesResults
If you disagree with this performance assessment, please file an issue in rust-lang/rustc-perf. Benchmarking this pull request likely means that it is perf-sensitive, so we're automatically marking it as not fit for rolling up. While you can manually mark this PR as fit for rollup, we strongly recommend not doing so since this PR may lead to changes in compiler perf. @bors rollup=never Footnotes |
|
Alright, the Apart from possibly some more wording changes you'd want to see, this PR looks ready to me. |
|
There's still a .5% regression in "deeply-nested-multi", whatever that is about. But the speedups are very nice. :) |
|
Comments look good to me. :) |
Yeah I saw that. That benchmark looks a bit noisy as of late:
The regression wasn't present in the previous runs of this PR, and when that benchmark did appear, it was a -1% win, likely noise again. Coupled to the fact that this is a stress test "secondary benchmark", the perfbot does not even count this as a noteworthy regression, so I won't either 🤡.
credit to @oli-obk who masterminded the fix. |

|
@RalfJung is there anything more you'd like me to do in this PR ? Or is it good enough for a r+ ? :) |
|
Sorry, I didn't realize I am the assigned reviewer.^^ |
|
📌 Commit d634f14 has been approved by |
|
☀️ Test successful - checks-actions |
|
Finished benchmarking commit (750d6f8): comparison url. Instruction count
Max RSS (memory usage)Results
CyclesResults
If you disagree with this performance assessment, please file an issue in rust-lang/rustc-perf. @rustbot label: -perf-regression Footnotes |
The interning of const allocations visits the mplace looking for references to intern. Walking big aggregates like big static arrays can be costly, so we only do it if the allocation we're interning contains references or interior mutability.
Walking ZSTs was avoided before, and this optimization is now applied to cases where there are no references/relocations either.
While initially looking at this in the context of #93215, I've been testing with smaller allocations than the 16GB one in that issue, and with different init/uninit patterns (esp. via padding).
In that example, by default,
eval_to_allocation_rawis the heaviest query followed byincr_comp_serialize_result_cache. So I'll show numbers when incremental compilation is disabled, to focus on the const allocations themselves at 95% of the compilation time, at bigger array sizes on these minimal examples likestatic ARRAY: [u64; LEN] = [0; LEN];.That is a close construction to parts of the
ctfe-stress-test-5benchmark, which has const allocations in the megabytes, while most crates usually have way smaller ones. This PR will have the most impact in these situations, as the walk during the interning starts to dominate the runtime.Unicode crates (some of which are present in our benchmarks) like
ucd,encoding_rs, etc come to mind as having bigger than usual allocations as well, because of big tables of code points (in the hundreds of KB, so still an order of magnitude or 2 less than the stress test).In a check build, for a single static array shown above, from 100 to 10^9 u64s (for lengths in powers of ten), the constant factors are lowered:
(log scales for easier comparisons)
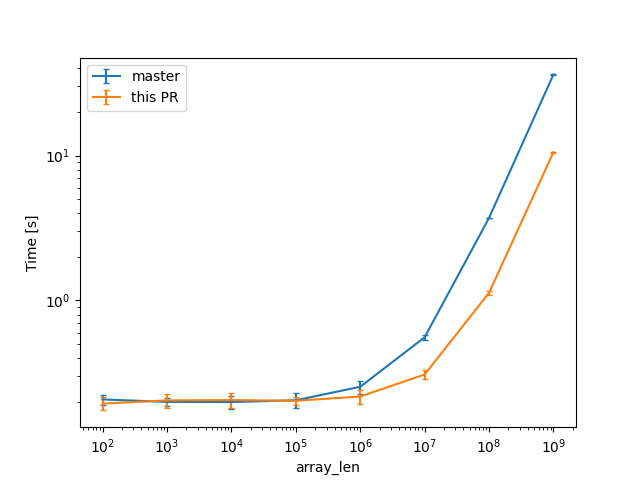
(linear scale for absolute diff at higher Ns)
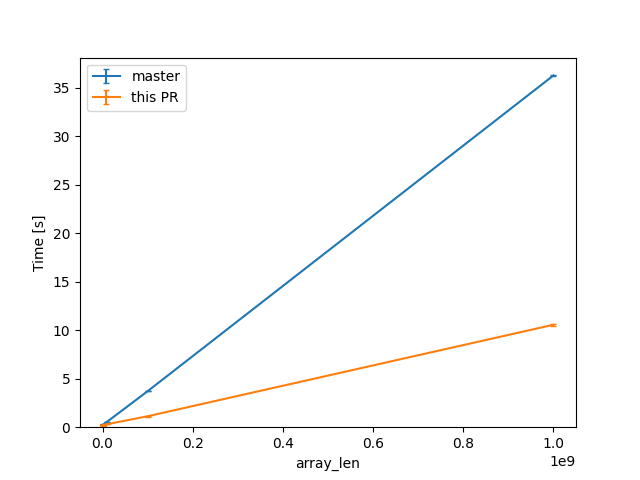
For one of the alternatives of that issue
we can see a similar reduction of around 3x (from 38s to 12s or so).
For the same size, the slowest case IIRC is when there are uninitialized bytes e.g. via padding
then interning/walking does not dominate anymore (but means there is likely still some interesting work left to do here).
Compile times in this case rise up quite a bit, and avoiding interning walks has less impact: around 23%, from 730s on master to 568s with this PR.